Clean Air  

OZONE MAPPING

On August 29, 2000 Janet and Lou went to the NC Division of Air Quality workshop on computer modeling for ground level ozone pollution.

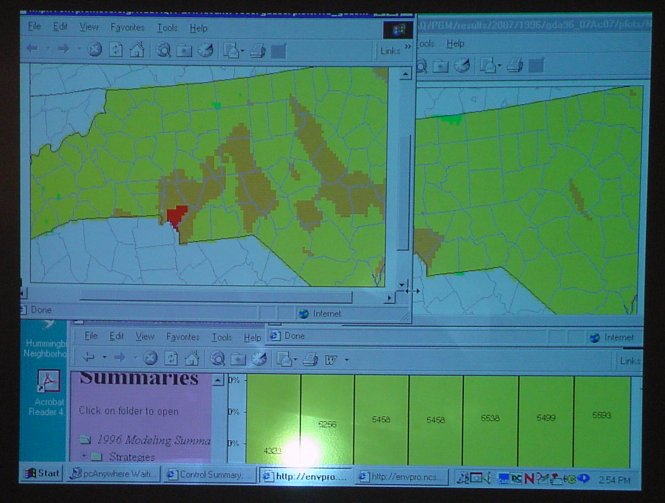
The photo below is one of the most striking maps displayed at the workshop. This map of episodic point sources uses utility CEM data to show what looks like orange plumes from Belews Creek, Cape Fear, Roxboro/Mayo plants extending southeast. These "plumes" are actually downwind high ozone levels created by the nitrogen oxide emissions from those coal-fired electric plants.


ozone map


BREDL Sept. 12, 2000 letter to NC EMC regarding ozone reductions for coal-fired power plants.